
Using the Carnegie Neighborhood Psychographics Report to Create Dynamic Message Segmentation at the ZIP Code Level
From the people we know to the regional culture and physical location of our hometown, where we grow up shapes how we understand the world. I was born and raised in what felt like the middle of nowhere, a small town not far from the border of Oregon and Idaho. I was also near the border of our county, between the Pacific and Mountain time zones, the border of the upper 45th parallel, and perhaps most salient to my current profession, the border of a Nielsen designated market area (DMA).
The Portland DMA is…weird. It stretches from the North Coast through the metro Portland area, all the way to the Idaho border. Growing up, I remember how we had two versions of NBC in our cable package—the Portland feed and the Boise feed—and while the programs were the same, the ads were different; not just the local ads, but versions of major national commercials differed simply by which channel we tuned in to. This was message segmentation in action, but imprecise execution. While I lived in the Portland DMA, the culture in Baker City, Oregon, was closer to that of the Boise DMA, and further still, the culture of the rural counties in the surrounding area was very different from downtown Boise.
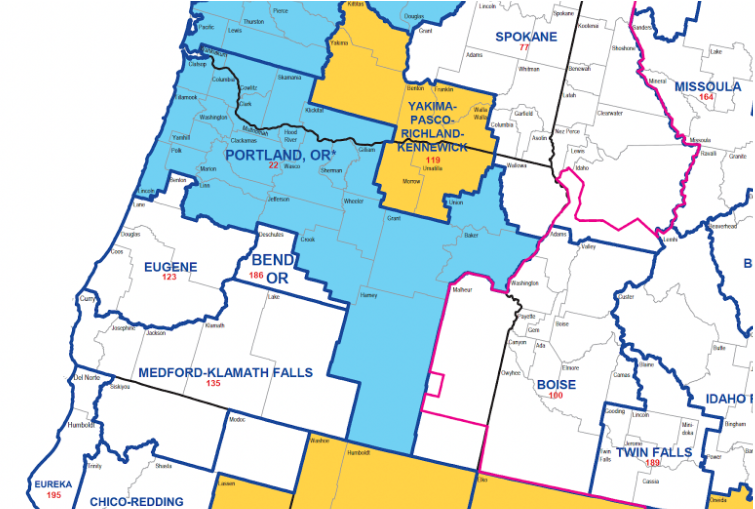
* The Portland DMA is in blue here.
Why differences within a DMA matter
Years later, an enrollment manager and his marketing colleague asked me how they could understand more specific areas within a market for message segmentation of institutional personality. It reminded me of the cultural differences of my small town to the major metro we were associated with in DMA terms. I also remembered a conversation I had with a friend I made while attending Washington State University. He was also from the Portland DMA, but actually Portland—the Pearl District to be exact. Our journey to a school in rural Washington was very different.
As part of Carnegie’s most recent research called the Carnegie Neighborhood Psychographics Report, I was able to look at the college preference differences between distinct types of ZIP Codes. Here’s one example: Gray is the US average for percent of students who would consider each type of institution. Can you guess which result is from my rural ZIP Code type and which is from my friend’s ZIP Code type near downtown Portland?
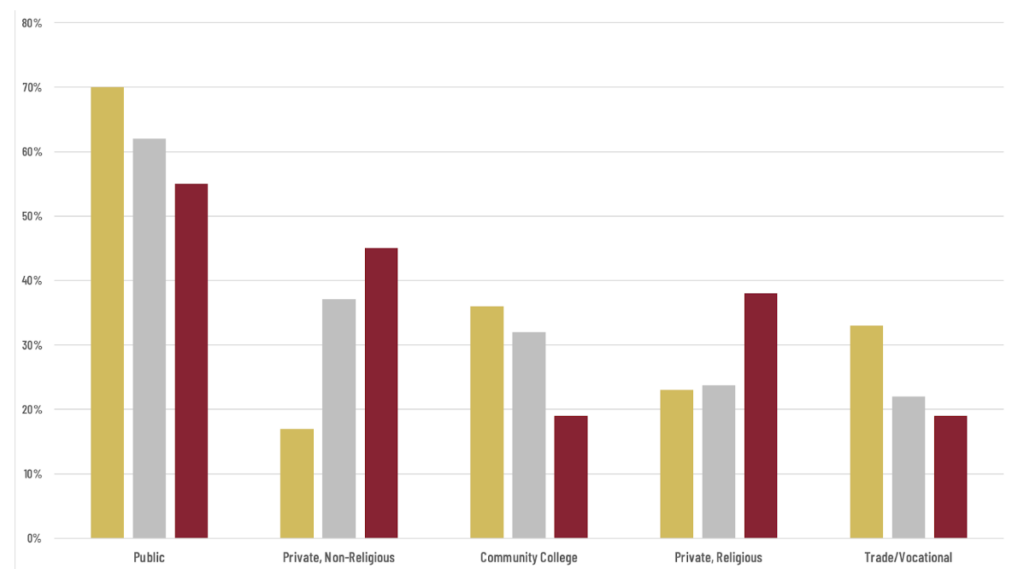
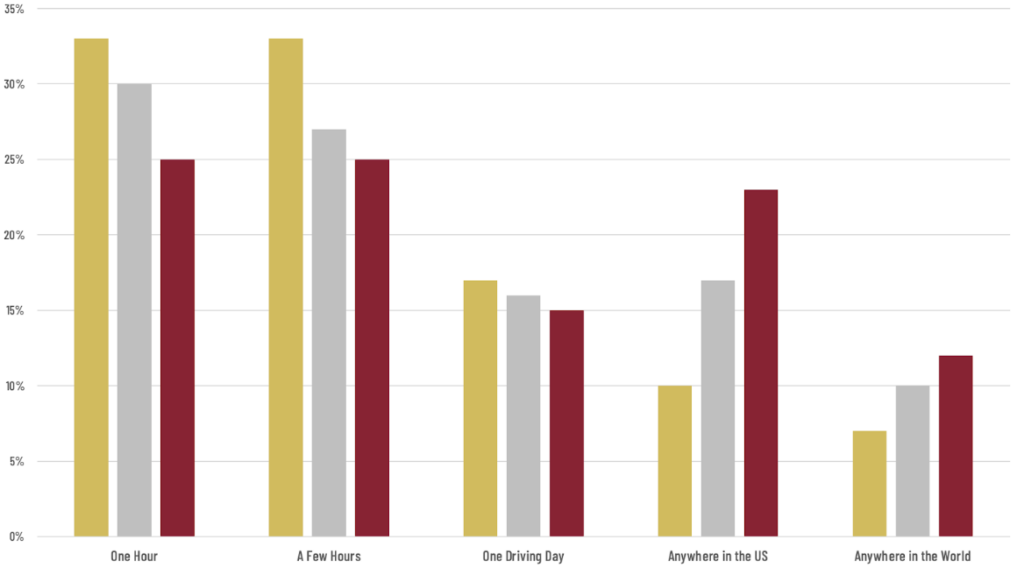
Okay, maybe not a surprise, but the gold bar represents ZIP Codes demographically and locationally, like Baker City 97814. Students in this far more rural type of ZIP Code had a higher likelihood of interest in public schools and especially trade schools. My friend’s ZIP Code type was more likely to attend private schools. Here’s another example asking those same respondents the farthest distance from home they would consider for higher education:
The problem with markets as monoliths
As seen here, the differences in preference for these ZIP Codes vary quite a bit. Despite this, my friend and I had received basically the same set of college advertising and enrollment materials—not because we were particularly alike, but because we both lived in the Portland DMA. This was a while back, so I’ll forgive most schools of the day. But in the 2020s, with the level of sophistication accessible to most schools for segmentation, sending a one-size-fits-some message at a broad market level instead of dynamic segmentation by households or ZIP Codes is a mistake.
At Carnegie, it was our mission to understand if this also holds true with personality and communication preferences. While household targeting for personality (like what’s found in our Darts and Motivator products) is ideal, it isn’t always possible, especially before a name purchase or high inquiry traction in a ZIP Code for a new market. As such, we decided to do in-depth national research on the personalities, communication preferences, hobbies, lifestyles, and college selection criteria of a large sample of prospective students within distinct ZIP Code types.