
The humble survey is still one of the most powerful tools for higher education institutions to understand how an audience thinks. Be it attracting students or engaging donors, evaluating changing trends in perceptions and opinions is critical to making good decisions and creating engaging communication. With user-friendly online survey builders available to anyone, it’s easy to think the artistry of a good survey is a thing of the past, like robotic phone calls or that annoying person flagging you down at the mall.
Survey design is truly an art directed by human psychology. How you ask questions matters. Even how a survey is arranged can dash it from the pinnacle of research methodologies to a worthless set of numbers collecting dust on a shelf. Luckily, if we understand human psychology, we can avoid survey pitfalls. For example…
1. We perceive vertically oriented text as discrete and horizontal text as a continuum
Consider these two images of a mock survey question created in two different ways:
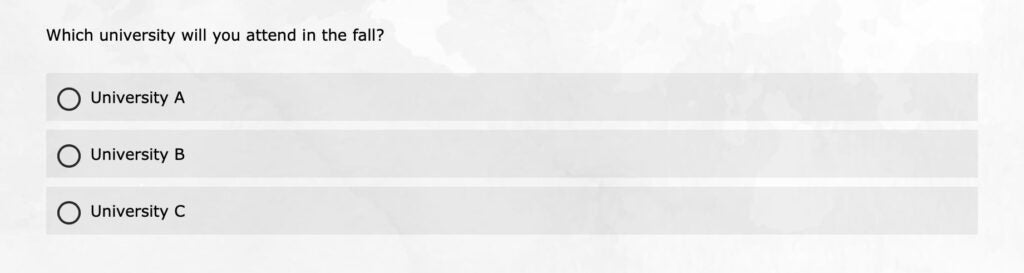
They’re the same question, but most people would say the second version feels off for some reason. The orientation of survey question response options, vertical or horizontal, has actually attracted a wealth of research (e.g. Maeda, 2014). The psychology underpinning the reason why a vertical list works better has to do with the power of the carriage return. Items on two different lines are interpreted by our brains as discrete. In other words, the relationship between the options is not on a spectrum.
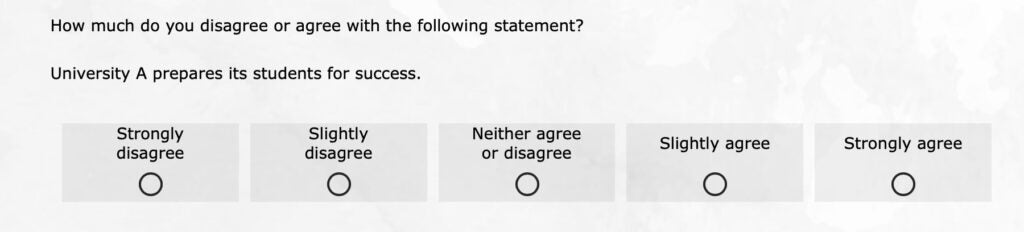
When we use a scale, something like “how much do you agree with this statement?” with five options from strongly disagree to strongly agree, a horizontal orientation will make more sense to the brain. Each outcome is compared on a spectrum. So when preparing an online survey, consider your question orientation. The one caveat: If you think your survey will be taken primarily on mobile screens, consider using a vertical orientation on all questions if possible as they fit the screen more readily. In continuum scales of either orientation, make sure you think about the order you create that scale because…
2. English-speaking audiences have “left-side bias” on scales
Here’s another survey question with alternative formats:
In this comparison, neither option feels off, but research has found responses will trend more toward the left side of the scale (Chyung et al., 2018). This is primarily because of something called the serial position effect and anchoring. We remember and identify with the first and last information we’re presented with and see the first item as an “anchor” to our perception. In English, we read left to right, introducing the bias.
So if the bias exists, which side of the scale should be on the left gaining that slight edge? If you’re comparing results to past surveys, it’s always important to replicate the order. However, if you’re starting fresh, I would suggest the first option in the images above: ordering “low” to “high” as you go left to right. Why? People tend to want to be agreeable, and disagree options are often ignored if people don’t have to read them on the right side of the scale. Part of this is because…
3. Even while anonymous on a device, people prefer to be socially desirable
Imagine students taking a survey and trying to determine if this initiative would be a success:
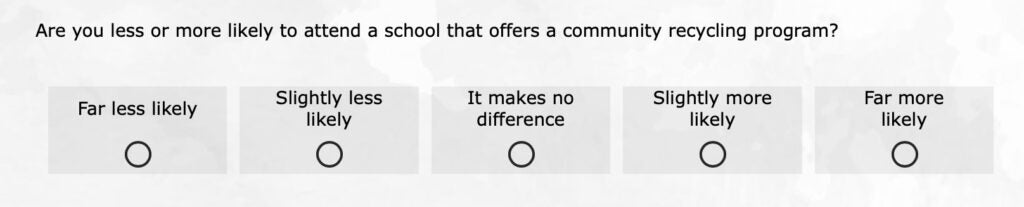
There is nothing outwardly wrong with this question, but anyone doing analysis should be careful with the results. Social desirability bias (Grimm, 2010) in survey research is built around the psychological principles of in-group and out-group motivation—most people want to be in the majority on topics of opinion. Recycling is, generally speaking, considered a positive social action. Very few people are going to admit they are “far less likely” to attend a school offering this, and many will affirm the “more likely” positions because it seems like a positive thing in general. This doesn’t mean your respondent is lying to you, but rather, they’ve been presented a question that is loaded with value judgment. Sometimes this is unavoidable, so don’t think this question needs to drown in the well of lost survey questions never to be used again. The results should simply receive the proper context.
Will a recycling program actually make students more likely to attend when considering all the other factors students use to make a college decision? Except in a few rare cases, probably not. The results might suggest that it doesn’t hurt, but behavioral motivation is so complex that a single factor like this is probably not making actual changes in the minds of students. Survey respondents typically answer honestly, but it’s important to know that…
4. Recall of the “truth” is limited
This is a question I used to see a lot in my days of doing mass media research:
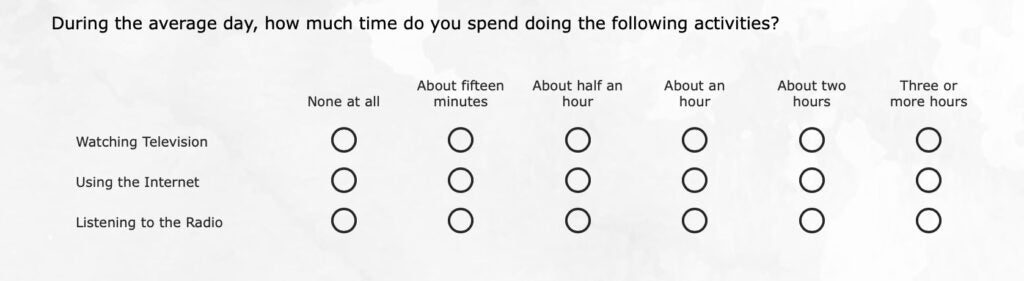
There are myriad reasons why I never used a scale for media use like this if I could avoid it, not the least being that the categories are uneven in size. But the greater problem, from a psychology standpoint, is that this question is about memory recall. Quite frankly, there are a lot of things we just don’t remember accurately because of limited capacity (explained by the aptly named Limited Capacity Model). Routine or daily things, such as media use, are hard to remember because we don’t bookmark the occasion with any novel experiences.
In a now somewhat famous experiment by Wade and colleagues (2002), researchers presented participants with doctored images from their childhood and asked them to recall a memory. Surprisingly, half of them concocted full or partial stories about the experience, even though it never happened. The real kicker: The fake image showed them in a hot air balloon, a very specific event that did not happen.
While this is a relatively extreme case of memory failure, it’s important to understand that some things we might expect students to remember are very difficult to recall in the moment. Did they apply to six schools or seven? How much money do their parents make? How often do they check their email?
The best way to avoid this issue is to make surveys about opinions, perceptions, and feelings in the moment, rather than trying to recreate a lot of factual information that could be misremembered. Unless the survey is specifically about recalling something like an ad, avoiding situations where people can inadvertently supply incorrect information is critical. Respondents will have a better time taking your surveys, which is important because…
5. Flow experience is critical to survey survivorship
Take a quick look at this set of questions:
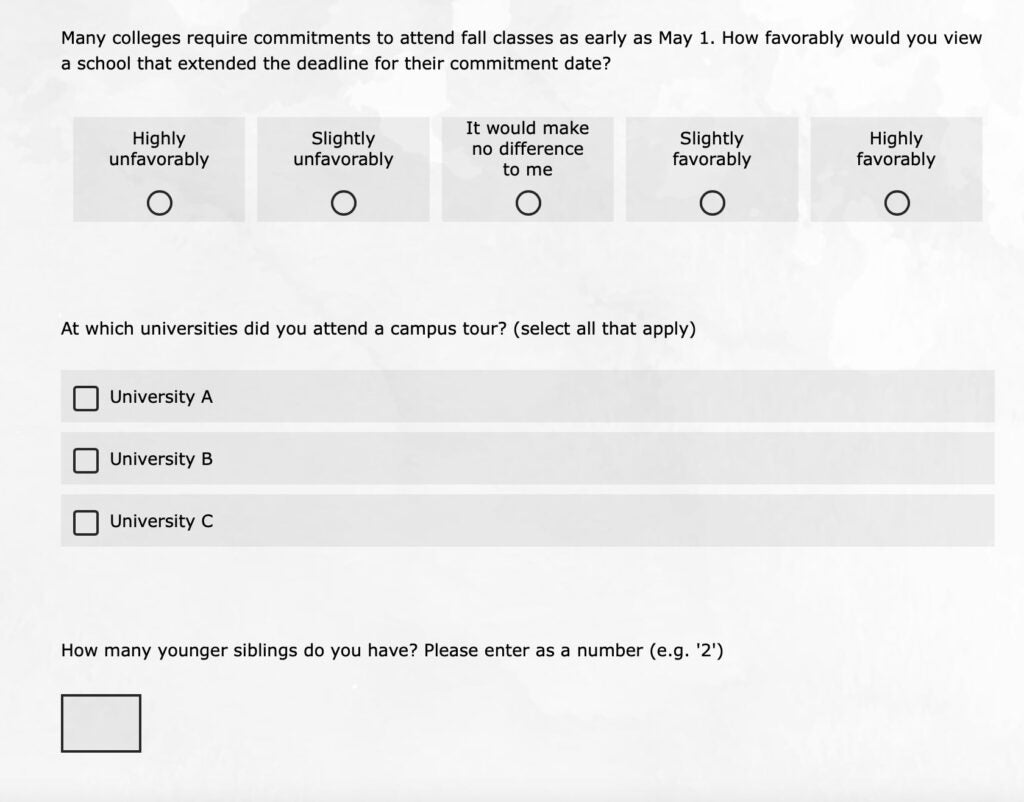
What an adventure. Three topics and three types of questions in rapid succession creates a much more arduous task than is necessary for survey respondents. It’s preferred to offer an experience that creates a flow state. More colloquially, some might call this being “in the zone,” and while that might sound silly in terms of a survey, it has a direct impact on people staying with your survey to the very end. The easiest way to create good flow is to make use of blocks and sectioning, as well as survey logic. Here are two core principles to follow: Ask similar topics in the same section and never ask a question that has already been invalidated by a previous question.
The latter issue is more common and detrimental. Having taken many customer satisfaction surveys in the past (I like to help my fellow researchers out), I’ve noticed that some will ignore my inputs and ask questions that show my previous answer was not considered. For example, if you ask a student about their familiarity with a university and they say they have none, it’s quite silly to follow that up with a question about the reputation of that university. Even if there is an option that says “I don’t know,” you have undermined the respondent’s flow by making them answer a question that, for them, should have never existed because they already answered it through a previous question. This is doubly dangerous because…
6. Concentration is a finite resource so surveys should be brief
I won’t bother you with an example here because it would carry on for several pages—and that’s the problem. The number of surveys I have seen going to students that exceed 50 pages or 20 minutes boggles my mind. I recognize the importance of many of the questions in these surveys, but the reality is concentration is limited. Research has found the total number of questions asked is important (Hoerger, 2010), as is the amount of time it takes to complete those questions (Qualtrics, 2021).
In psychology, this can be traced to many factors, but I’ll be quick to point out this is not a rant about young people lacking attention spans. This phenomenon extends beyond generations. Even the most well-meaning, focused survey respondent will begin to falter under the weight of a survey that just seems to drag on forever. Focus and trim. You’ll typically find that the data you get will be better for two reasons: respondent focus and your ability to wade into the data and find the things that are actionable.
My Survey Design Mantra
So to take some of my own advice (I had probably another 2,000 words left in me), I will wrap up this blog with the question I always ask myself when preparing survey questions. It’s a simple question, and doesn’t get into all the nuances of psychology, but it serves as the foundation for the data that’s going to be the most useful to you. Review your questions and ask yourself…
Can a person answer this survey honestly and accurately?
Want to hear more from Jared Brickman? You can follow him on Linkedin and if you haven’t already, you can subscribe to our blog.
References
Chyung, S.Y., Kennedy, M., & Campbell, I. (2018). Evidence-based survey design: the use of ascending or descending order of Likert-type response options. Performance Improvement, 57(9), 9-16. doi: https://doi.org/10.1002/pfi.21800
Grimm, P. (2010). Social desirability bias. Wiley international encyclopedia of marketing, 2. doi: https://doi.org/10.1002/9781444316568.wiem02057
Hoerger, M. (2010). Participant dropout as a function of survey length in internet-mediated university studies. Cyberpsychology, Behavior, and Social Networking, 13(6), 697-700. doi: https://doi.org/10.1089/cyber.2009.0445
Maeda, H. (2014). Response option configuration of online administered Likert scales. International Journal of Social Research Methodology, 18(1). doi: https://doi.org/10.1080/13645579.2014.885159
Qualtrics (2021). Survey Methodology & Compliance Best Practices. Qualtrics Support. Retrieved from: https://www.qualtrics.com/support/survey-platform/survey-module/survey-checker/survey-methodology-compliance-best-practices/
Wade, K., Garry, M., Read, J.D., Lindsay, D.S. (2002). A picture is worth a thousand lies: using false photographs to create false childhood memories. Pscyhonomic Bulletin & Review, 9, 597-603). doi: https://doi.org/10.3758/BF03196318