

Google Analytics 4 (GA4) is up and running, but do you know how to get data to share with your institution’s stakeholders? There are many standard reports and Explorations in GA4 that can be helpful for higher education marketers, but don’t always answer all the questions you may have. Where are website users coming from that fill out the Request for Information form? Is social traffic leading to an increase in application submissions?
When you want to answer questions on a regular basis or narrow in on the data to get more insights, setting up a Looker Studio (LS) dashboard can get you and your stakeholders directly to the answers without having to navigate the GA4 console. Higher ed marketers who aren’t used to working in GA4 may find it quicker and easier to open an LS dashboard to see the data rather than having to be added as a user to GA4. Setting up a dashboard can be helpful to get the information you need about your institution’s website, like engagement rate and key conversions, but can seem intimidating if you aren’t sure how to pull data from the Google Analytics dimensions and metrics available.
Use the following guidelines to start your custom LS dashboard to analyze your institution’s GA4 data.
Setting Up Your Custom Looker Studio Dashboard
When setting up your Looker Studio dashboard, there are some important considerations when choosing your data source:
- You can connect your LS dashboard to your GA4 data source through the Google Analytics API. This will give you access to the data with query limits and token limits being the only data limitation.
- If you have BigQuery set up to store your GA4 data, you could connect a summary table as a data source without token limits, just query usage costs in BigQuery.
Now that your data source is connected, what are the questions you want to answer about your institution’s website performance with the dashboard? The following is not an exhaustive list of pages and charts, but a starting point for creating your dashboard.
What website pages are getting the most engagement?
- Create a page to show engagement data.
- Create a table using the dimension page location or page path.
- Add the metrics sessions, engaged sessions, engagement rate (formatted as number > percent), and user engagement/user (custom formula).
- Experiment with additional charts and styles. For example, create scorecards to look at individual metrics with increases or decreases. Add a date comparison for the previous month or previous year.
What is driving the most users to key events?
- Add a date range control to your dashboard to show only the date range you intend. A good default is to set it to last month.
- Make sure you have your GA4 property set up and collecting key events. Be sure to watch our webinar about setting up events in GA4 to track website behavior. Once you have key events set up to track Request for Information, Event registration and Application submissions, you will be able to glean more insights about how users came to the site that completed these important actions.
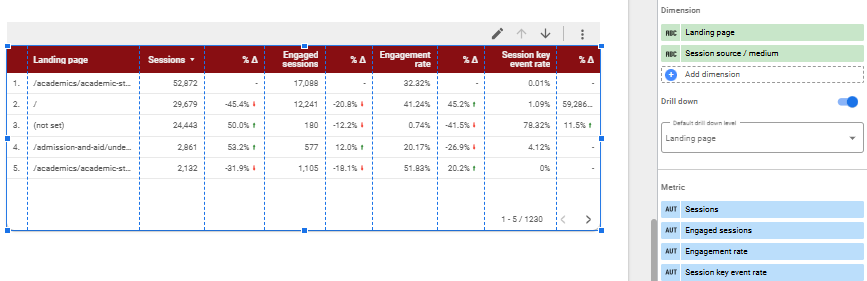
- On your Looker Studio dashboard, create a page for key events.
- Create a table using the landing page dimension. This will give you the metrics across the entire session that started on the landing page rather than just metrics for a single page.
- Add the metrics sessions, engaged sessions, engagement rate, and session key event rate.
- Looking for traffic acquisition? Add session source, session medium and session campaign as dimensions.
Putting Your Looker Studio to Use
Once you set up your Looker Studio dashboard, it becomes a great reference point to check in on the data on a regular basis for analysis and insights on your institution’s website user behavior. Bookmark the page to easily return to the dashboard.
When you’re ready to share with your stakeholders, click on the share button in the top right corner to set permissions, add users to the report, or create a link to share. Experiment with additional charts and controls to add additional data points as needed.
Partner with Carnegie on GA4
Still need help setting up a Looker Studio dashboard? We’re here to help. Our GA4 experts at Carnegie will set up a custom dashboard to track student behavior, measure key conversion events, and improve the digital marketing strategy for your college or university. Start a conversation today to get started.