
Measuring SEO Performance 101: Metrics Higher Ed Marketers Need to Know
As a higher-ed marketer, you want to make data-driven decisions to maximize the results of your marketing efforts. However, when it comes to tracking the effectiveness of your Search Engine Optimization (SEO) strategy, it can be intimidating to know where to begin. What data is most valuable to your institution and its goals? What metrics and key performance indicators (KPIs) should you be monitoring?
The foundational components for measuring performance metrics and KPIs play important but differing roles. One easy way to tell the difference between the two is to remember that all KPIs are metrics, but not all metrics are KPIs. A metric is a data point or other quantifiable measure you might use to monitor performance, but that isn’t an integral marker of success or ROI. For example, if your goal is to increase enrollment, a metric might be organic impressions, while a KPI might be the conversion rate. KPIs can help you focus your efforts on the metrics that will offer insight into the most vital aspects of your SEO strategy.
SEO Performance Metrics and Measurement Tools
Typically, you can measure your college or university’s organic website performance through several metrics. The two most basic (and free!) tools you can use to measure these metrics are Google Search Console (GSC) and Google Analytics 4 (GA4).
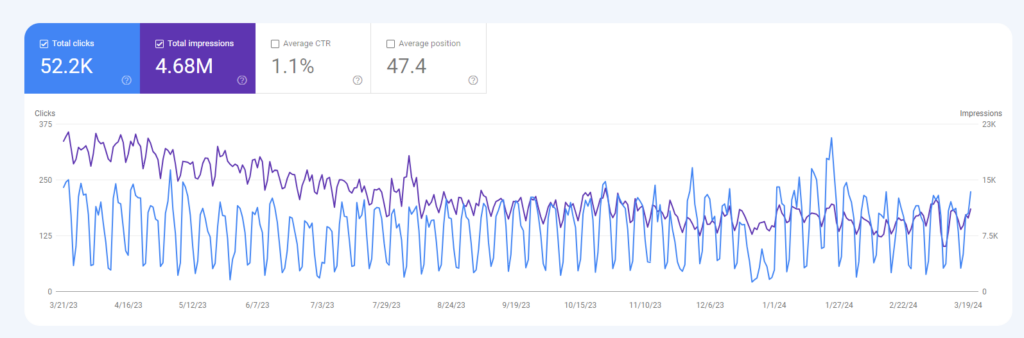
You can find the organic impressions and clicks for your website in GSC, a tool that shows only Google organic traffic data. Here, you can filter by date range, search query, landing page, and more to get a clearer picture of how your website is performing in organic search results.
To find data about how prospective students engage with your website, you can use GA4. Because GA4 shows data about your website’s many traffic sources—such as display ads, direct, organic, email, and paid—you should ensure you use the appropriate source filters to look only at organic data when measuring for SEO.
Paid tools, such as SEMRush, can also prove helpful in understanding how your institution’s website performs in organic search results, particularly in relation to keyword ranking and local and national visibility. We’ll talk more about SEMRush and other helpful SEO tools in the next blog in this series, Measuring SEO Performance 201.
SEO Metrics You Can Find in Google Search Console
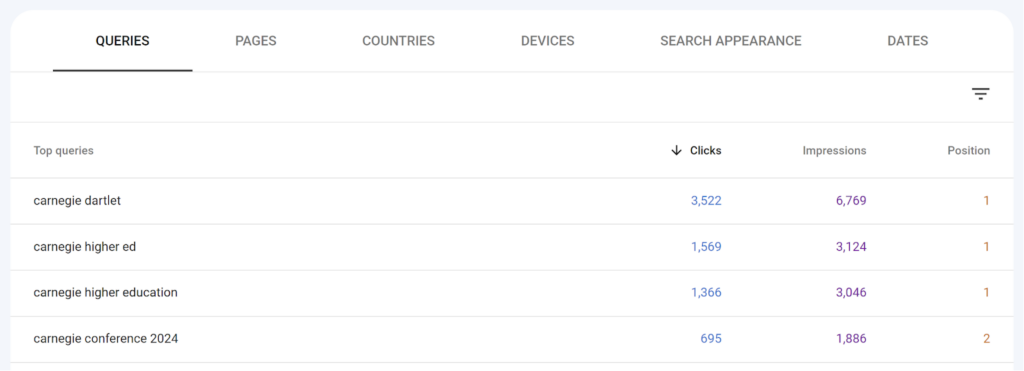
In Google Search Console, you can filter data to gain insights into your institution’s website performance in Google organic search results. After logging in, navigate to “Performance” and select “Search results.” Here, you can apply various filters such as date range, query, page, country, and search appearance.
For instance, you can choose to compare your selected date range either period over period (PoP) or year over year (YoY) to understand organic traffic performance trends over time. When selecting your date range, keep in mind that GSC only retains data from the previous 16 months.
For more granular data insights, you can also filter by queries containing or matching a certain keyword, URL folder path (such as all pages under /programs), or individual URLs. These filtering methods provide an excellent starting point for your keyword research and can help you analyze data more effectively to strategically optimize your website.
Organic Impressions
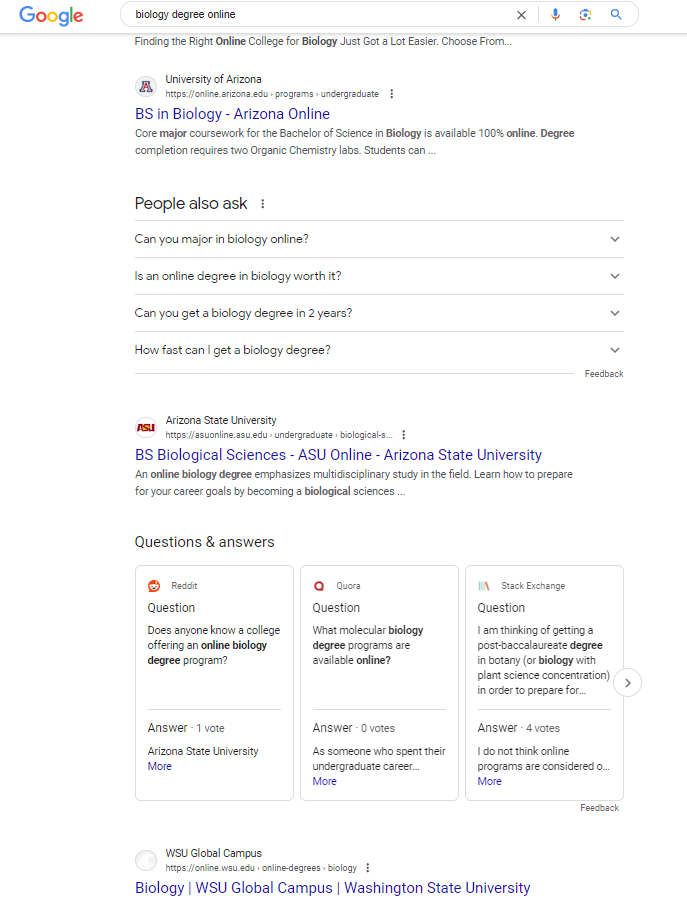
An organic impression refers to any time a user can see your listing—a page from your website—in organic search results. This occurs when a prospective student enters a query and search engines like Google serve up your content in the results. Remember, these impressions don’t include impressions from advertising campaigns.
Impressions tell you how visible your content is on the search engine results page (SERP). A prospective student needs to see your listing to click on it, so if one of your high-priority pages isn’t getting many impressions, you may see low-traffic numbers.
It’s important to distinguish, however, between impressions in general and meaningful impressions—not all impressions are of equal value. For instance, let’s say your Atmospheric Sciences program page has thousands of impressions for the keyword “weather.” You might initially see this as a positive; your page has a high level of visibility for a keyword searched by millions every day.
However, in this example, the keyword does not match the content of the page, meaning you’re unlikely to rank highly on the SERP, and users are even less likely to click through to the website; your content does not match their search intent.
Organic Clicks
While impressions represent how many times your organic listing is shown on the search result page, a click occurs whenever a user clicks on your listing.
Click data can help you better understand the organic traffic to your website. However, it’s important to note that clicks are not the same as users; or rather, there is not a 1:1 ratio of clicks to users—one user can click on your search result many times.
While the total number of clicks can be an important indicator of traffic, click-through rate (CTR) plays an even larger role in determining the success of your content.
Click-Through Rate (CTR)
Click-through rate refers to the ratio of impressions to clicks. For example, if a page on your website has 100 impressions and 50 clicks, the CTR would be 50% because half of the users who saw your listing on the SERP clicked on the URL.
For higher ed websites, a good benchmark for overall site CTR is between 2% and 3%. We tend to see page-level CTR in the 1% to 2% range. By comparing against these industry benchmarks, you can get an idea of how your organic traffic performance measures up to competitors.
If you notice that your web page’s CTR is lower than the benchmark, it indicates an opportunity to better optimize your content. Learn more about higher education content marketing
Keyword Ranking
Keyword ranking refers to where you rank on the SERP for any given keyword. The higher your content ranks, the more visibility your website gets. Generally speaking, content ranking in positions one through 10 would be considered ranking on page one; positions 11 through 20 on page two; 21 to 30 on page three, and so on.
While Google has implemented continuous scrolling and there are no longer “pages” of search results, these guidelines give you a broad idea of where your content appears on the SERP and how visible you are to users.
You can see keyword ranking in Google Search Console, filtering by page to see how a particular piece of content is performing or by keyword to see what pages on your website appear for a specific search term.
Branded vs. Non-Branded Organic Traffic
When you review the performance of your site, you’ll notice that organic traffic can come from keywords that are branded (queries that include your institution’s name) or non-branded (queries that don’t include your institution’s name). For example, “MBA program” is a non-branded keyword, and “MBA program at MIT” is a branded keyword.
Branded keywords show brand awareness, as these users are searching for information specifically related to your institution. Because of this targeted search intent, you may notice a higher CTR for branded terms.
Non-branded terms present an opportunity to reach prospective students who may have never heard about your brand before but are looking for a program that you offer. Appearing for non-branded search queries can be more challenging as you are competing with all other institutions that offer the same program.
SEO Metrics You Can Find in Google Analytics 4
In Google Analytics 4, accessing SEO data involves utilizing the Acquisition reports to segment and analyze website traffic based on specific search-related criteria. After logging into your GA4 account, navigate to the “Reports” section where you can look at “Traffic acquisition” and “User acquisition” reports and tailor them to showcase organic traffic only. From here, you can drill down into the specific landing pages you want to analyze by filtering the data.
These filtering options enable you to gain valuable insights into organic search performance, brand reach, and user behavior, enabling you to apply a data-informed approach to your website optimization efforts.
Organic Sessions
In Google Analytics 4, a session is “a period of time during which a user interacts with your website or app.” In order to measure SEO performance, you want to filter to organic sessions in the tool.
When a user clicks through to your site, their session begins. As long as they continue interacting with the site, their session continues. However, after 30 minutes of inactivity, the session automatically ends. GA4 allows you to adjust the default session timeout according to your institution’s needs. Learn more about setting up your higher education institution’s GA4 property.
GA4 calculates the number of sessions by assigning each user a unique session ID—a timestamp denoting the session’s start—and a session number, which pinpoints how many sessions can be attributed to a user.
Similarly to other data points, there is overlap and interplay between sessions and other metrics, such as users and engagement.
Within the general session metric are subsets of session metrics—engaged sessions, sessions per user, and engaged sessions per user. These session metrics offer valuable insight into the number of sessions, as well as their quality. If engaged sessions and engaged sessions per user are high, then this indicates that users find the content on your site to be useful and interactive.
Organic Users
While ‘user’ may refer to anyone who visited your site during a specified time, Google Analytics breaks this metric into four user metrics to provide a clearer picture of user behavior.
- Total users – the total number of people who visited your site and logged any event.
- New users – Users who have never visited your site or triggered the “first_open” or “first_visit” event.
- Active users – Unique users who interact with your website and have an engaged session.
- Returning users – Unique users who began a previous session within the specific date range.
In order to measure SEO performance, you want to filter to organic users.
Need help setting up your GA4 account or want customized reports and data insights? Carnegie can help!
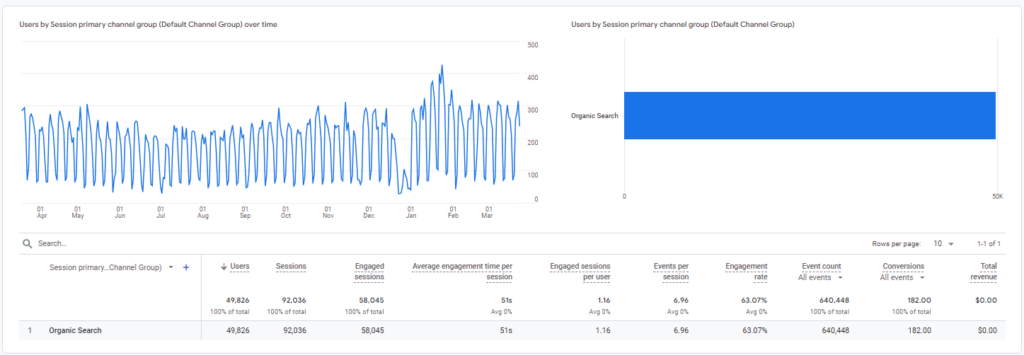
Engagement Rate
Before GA4 replaced Universal Analytics, SEOs measured engagement by checking the bounce rate: the percentage of users who landed on a website and immediately left. We wanted to see this number as low as possible as it meant that fewer users “bounced” from the site.
Now that UA has sunset, the engagement rate looks a little different. GA4 measures engagement rate as the percentage of engaged sessions compared to the total number of sessions. In other words, if there were a total of 100 sessions on a webpage and 75 of them were engaged, the engagement rate would be 75%.
But what counts as an engaged session? Google Analytics tells us that an engaged session is “a session that lasts longer than 10 seconds, has a conversion event, or has at least 2 pageviews or screenviews.”
Conversions
You can see conversion data in GA4—this information tells you when a user has taken a converting action on your website. To utilize this metric, you must manually set up conversions.
There are default ‘events’ in GA4, which include file download, form submit, video start, and more. You can mark these automatically collected events as conversion events, allowing you to easily track and review these in reports.
For a more personalized approach, you can set up custom conversion events for things like requests for information and application submission, account creation, or info session registration. This enables you to see exactly what action users are taking on your website and the value of your content in your enrollment marketing strategy.
Content that is helpful, relevant, engaging, and trustworthy is more likely to see conversions — this is where stacking your analysis of metrics can tell the larger story of the success of your work.
For instance, you might start by looking at your engagement rate to determine how interactive users are on a webpage. If you notice low conversions on a low engagement rate page, consider adding more informative and robust content.
On the other hand, if you notice a page has a high rate of engagement and low conversions, consider the placement of your CTAs or try embedding an RFI form on the page to increase the likelihood of a user taking the desired action.
Determining the KPIs of Your College or University’s SEO Strategy
Once you have a clear understanding of the metrics you should analyze to measure SEO performance, you should start to define your KPIs. However, before selecting your key performance indicators, your first step starts with outlining the primary objectives of your marketing strategy. While metrics are mere data points, KPIs are data points directly tied to specific goals. They provide context to understand the efficacy of your strategy and gauge your institution’s progress toward meeting its objectives.
Common SEO KPIs include but are not limited to, CTR, engagement rate, and conversions because they indicate the fundamental goals of optimization work—website traffic, user experience, and enrollment. A higher CTR translates to an increase in organic traffic. Likewise, a higher engagement rate suggests that website content is of high quality and meets the users’ needs, prompting them to travel deeper into the site and interact with more pages. And lastly, when your number of conversions grows, you can infer an increase in lead generation.
While not the only means of measuring your marketing success, KPIs are a great place to start reviewing for optimization opportunities or monitoring the impact of your ongoing SEO work.
Harness SEO Data for Strategic Content Creation
Understanding these SEO metrics and KPIs not only helps you measure your success but also enables you to better identify areas of your website that need improvement. With that, you can allocate time and resources to implement optimizations strategically.
Want to keep learning about how to leverage your SEO performance data? Stay tuned for the forthcoming Measuring SEO Performance 201 blog to gain more insight into evaluating and making sense of your SEO metrics and KPIs.
Need assistance with your SEO efforts? Carnegie can help. Contact us today to learn more about our search engine optimization services for higher education institutions.
This blog was written by SEO Content Associates Kelsey Peludat and Lily Tobias.